That's sad...
Mine at least at times goes to positive. And quite a bit.

Comment has been collapsed.
Bump and thank you.
Mine is like 35 % green 65% red.
Comment has been collapsed.
I have been more lucky lately.

Comment has been collapsed.
You win!
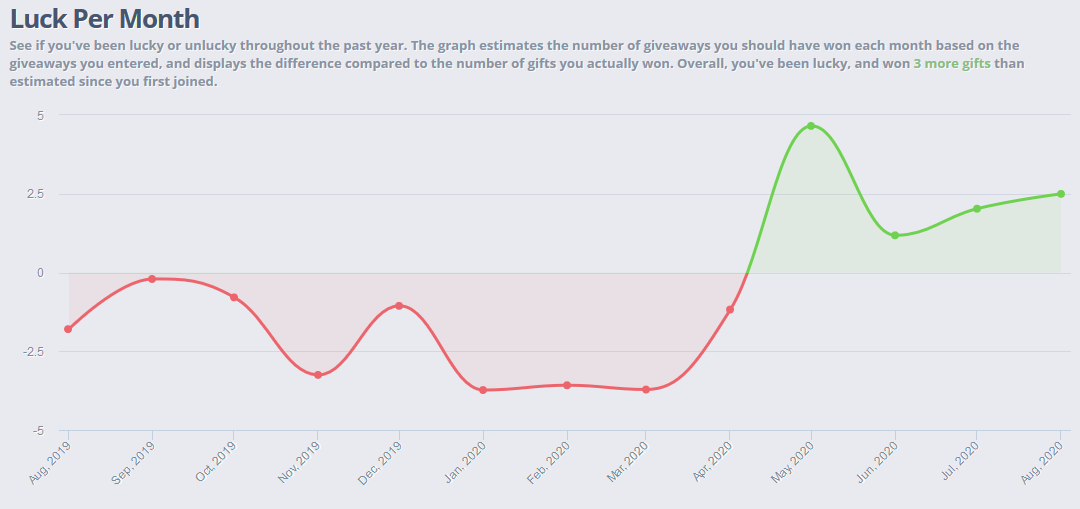
Weirdly I'm sure I'm entering fewer giveaways as I focus more on wishlist-only or games I actually will play. Yet my 'luck' has increased, and that despite "Overall, you've been unlucky, and won 62 fewer gifts than estimated since you first joined". I've no idea how this is calculated.

Comment has been collapsed.
Let's say you entered 10 ga with only 2 entries each, you and someone else. It's a fifty-fifty situation so both of you are expecting to win 5 ga.
But now you win only 3 of those ga, it means you're unlucky and won 2 fewer gifts than expected according to the probabilities.
Comment has been collapsed.
Quite inexact : you're right when saying he's unluckier than expected ; but wrong when saying it's according to probabilities.
The simple example to always have in mind is :
When you draw 10 times a coin, every possibility has the same probability to happen : 10 times heads has the same probability than 10 times tails than 5 times heads and 5 times tails, and so on in every order.
That's because when you draw the coin, each time you draw it the probability of head or tail is always 50/50, whatever the previous draw was or whatever the next one will be.
TL;DR : you're confusing a probability with an expectation of gain (which is often the statistical average and not the probability)
Comment has been collapsed.
But I never said that the ga have to be in a row or that each one is not independent from the others.
When you draw 10 times a coin, every possibility has the same probability to happen : 10 times heads has the same probability than 10 times tails than 5 times heads and 5 times tails, and so on in every order.
I have to disagree with you on that, you're right about the probability of 10 heads = 10 tails (only 1 scenario possible) but it's different from the others combinaisons, for example 7 head and 3 tails can happen in many scenarios (HHHHHHHTTT or HTHHTHHTHH or TTHHHHTHHH or HHHTTTHHHH etc etc etc) each one of those have the same probabilities to occur but it's different for the results since we don't care of each specific order
So 5 heads and 5 tails will happen much more often than 10 heads or 10 tails only. It will be the most frequent result and 10 times of the same will be the least.
Comment has been collapsed.
and so on in every order.
Nobody's perfect, I was thinking about things in order, so 5H and 5T = HHHHHTTTTT
Anyway:
So 5 heads and 5 tails will happen much more often than 10 heads or 10 tails only. It will be the most frequent result and 10 times of the same will be the least.
Saying "happen much more often" is a statistic, not a probability. A statistic is not the result of a single real draw and each single real draw has the same probability to happen (whatever the statistics are, yes, this is counter-intuitive, but the statistic being the consequence of the equiprobability of all the possible draws, it cannot at the same time be the cause of any single one), so back to your initial example :
It's a fifty-fifty situation so both of you are expecting to win 5 ga.
Let me show you it's still biased because you're both expecting more than what is probable to happen.
You're expecting any order of 5H + 5T to happen very likely, but neglecting that any order of NOT ( 5H + 5T ) can also happen.
Are there more or less of the former or the latter?
Counting them with 4 coins draws, that's 16 possibilities with only 6 of them being 50/50 marked (=) below :
HHHH, HHHT, HHTH, HHTT(=), HTHH, HTHT(=), HTTH(=), HTTT, THHH, THHT(=), THTH(=), THTT, TTHH(=), TTHT, TTTH, TTTT
Thus, with 4 coins draws, you have 6/16 = 37,5% chance of the results being evenly distributed, and 10/16 = 62,5% chance of the results being NOT evenly distributed... that's not even close to a fifty/fifty situation like you had in mind !
In other words : an even distribution of equiprobable draws is less likely to happen than an uneven one is the general rule of thumb!
The only exception is when you draw 2 coins only, because each coin has 2 sides, so it's even with 50% chance. Thus if you take a dice with 6 sides, you need more than 6 draws to see uneven series of draws happening more often than even ones ; and any giveaway with X number of entries is the same a a dice with X sides.
As a consequence : more giveaways means a higher chance of UNeven distribution of the gifts (but this is true only when everyone enters every GA, which is not the case in reality)
¯\_(ツ)_/¯
Comment has been collapsed.
you're calculating the probability that the expected number of wins will actually happen.
Yes, exact : I'm calculating the probability that the expectation of even gain will happen. Or in other words the likeliness the statistical average becomes real.
Your expected number of wins will still be 8 out of 16 regardless.
You didn't got my point : you expect the statistical average to happen, which is in reality not likely to happen.
The expected number of wins for 16 giveaways with only 2 entries each is 8, the probability that you'll get exactly 8 is only 37.5%, more than 8 wins is 31.25%, and less than 8 wins is 31.25%.
Wrong, but that's my fault ; I even got a headache reading me again today.
37,5% is the probability to win 2 draws out of 4 and not 8 draws out of 16.
I should had written : « Thus, with 4 draws, you have 6/16 ... » instead of « Thus, with 16 draws, you have 6/16 ... »
I edited my post above, tell me if it's better please ?
Comment has been collapsed.
Instead of rephrasing the same idea again, just look at the figures :
Some reading there and I borrowed the solution there
Given 500 giveaways with 250 entries each, you are expecting to win a statistical average of (1 / 250) x 500 = 2 gifts.
BUT
what is the probability to win at least 2 gifts ?
P(win none) = (249 / 250) ^ 500
P(win none) = 0,13479

P(win 1) = 500 x ( (249 / 250) ^ 499 x (1 / 250) ) because 500 ways to win once
P(win 1) = 0,27067

P(win 1 or fewer) = P(win 1) + P(win none)
P(win 1 or fewer) = 0,27067 + 0,13479
P(win 1 or fewer) = 0,40546

P(win at least 2) = 1 - P(win 1 or fewer)
P(win at least 2) = 1 - 0,40546
P(win at least 2) = 0,59454
You deserve a ~59,454% chance to win at least the statistical average you expected, which is more than 50%.
As I'm repeatedly repeating : chances are NOT even with higher probability than even!
Where did you find the information that « The graph is the statistical average » as you said ?
Comment has been collapsed.
From my personal experience it works like this: (unless it has been changed since)
Few years ago I entered a massive ga from some devs with more copies than entries, something like 20k copies for 16k or 18k entries, so everyone had a garanteed win.
The same day I had a lot of ga ending from a puzzle/event that I managed to solve and also maybe from group/whitelist, so dozens of ga with very few entries (I believe it was before the 5 entries rule so people didn't care about it)
On the first graph here https://www.steamgifts.com/stats/personal/community If you check for today you see in blue the winning % for the ga already ended and in gray for the ga not ended yet.
So at the beginning of the day my graph was hitting 100% because of the garanteed win from the massive ga. I won it, after that the gray value was still at 100% because all the ga with about 2 to 5 entries each I was in, I won a second ga, and again it was still at 100%, later that day I won a third one, and then the gray value was about 52% (I don't rememeber exactly) and that's it.
So it was like I had a 350% of winning for that day (I know that doesn't make any sense).
I won 3 ga and I got -0.5 added on the graph "Luck per month"
That's why I went for the easiest and fastest explaination in my first comment: 1/2+1/2+1/2.... 10 times = 5
Another example with a ga with 5 entries, (so 20% in the first graph) if you win, it will add 0.8 on the second graph and if you loose -0.2
Comment has been collapsed.
So it was like I had a 350% of winning for that day (I know that doesn't make any sense).
What makes sense it to separately sum up guaranteed wins on their own and probabilistic wins apart (summing them or not is a whole debate). Let's see below how the lack of loser in a guaranteed win giveaway make the 100% probability to win (1st graph) disappearing from the luck graph (2nd graph).
That's why I went for the easiest and fastest explaination in my first comment: 1/2+1/2+1/2.... 10 times = 5
Ok, so that's not the right half, and since both halves are equal, the figure is the same, but it's the wrong one, hence leading to more erroneous conclusions! Let's see your other example:
Another example with a ga with 5 entries, (so 20% in the first graph) if you win, it will add 0.8 on the second graph and if you loose -0.2
Winning a GA means you're luckier than the N losers (you somewhat defeated them), so it adds their (summed) probability to win to your luck.
Loosing a GA means someone else was luckier than you, so it subtract her/his probability to win from your luck (and the same for each other).
Summing up all of this is always zero, thus it's a zero-sum game with correct expectations for every side : hence luck is defined as a relative, transactional concept in which you're lucky when you receive wins and unlucky when you give losses (not games, losses).
The curve is meaningful in the common sense : when it goes up, it means you're getting luckier over time (receiving more), and conversely. It is related to the way our brains understand the idea of odds for/against (read there : the odds against red is how much reds are luckier than non-reds when they win).
I've put my cursor over each dot of my graph (only 8 dots here), and summed up the figures, and this gives the same number as in the text above the graph (rounded, but same number).

Comment has been collapsed.
I don't understand why you're explaining again what I just said.
if you win, it will add 0.8 on the second graph and if you loose -0.2
But you're not alone to loose, 5 entries means 1 winner and 4 loosers. (-0.2)+(-0.2)+(-0.2)+(-0.2)+ 0.8 = 0
So yes everything balance out, If we add everyone's graph the result will be null.
What's your point, I don't get it.
Comment has been collapsed.
What's your point, I don't get it.
There's another way to understand the idea of luck, instead of the relative evenness of the wins and losses it can be seen as an absolute winning of more than an average probability, and here comes the misunderstanding between the average probability and the statistical average. As I computed above, if one expect to win the statistical average, one will have more than the average probability to win it because one can obviously win more, hence a biased perception of one's luck in its absolute meaning : what you have the average probability to win is more than what is won on the statistical average. This is counter intuitive, but it means that the statistic takes into account the losses that had happened, when the probability hopes for them not to happen. As I did, to compute what is an average expectation to win, one should not average all the possible results but instead take from all the possible results the ratio of the good outcomes over the bad ones, and that's definitely not the same computation, with different results !
Comment has been collapsed.
Today I checked my graph before I entered a ga with 5 entries (so 6 with me would be 16.67%), before I had 1.59% and after I had 17.99%, I was expecting it to be 18.26% so I don't know where the 0.27% remaining went, this might be caused by some entries from others ga at the exact same time. I'm not sure.
If not, it looks like it's different from what I said yesterday, maybe now you can't reach 100% and it can only tend to 99,99%.
We can't know for sure unless we can check somewhere how the site handle the maths behind this.
Anyway I think it shouldn't be able to reach 100%, because many things can happen, like the creator deleting his ga or asking for a reroll or not sending the gift etc and thus not getting a win in the end, but that's another topic.
Comment has been collapsed.
Yep, confirmed here, it doesn't add like you said : by entering a ga with 1 entry (not including me), I see the figure on the 1st graph to grow from 7,85% up to 53,92%, that's only a 46,07% increase, when intuitive reasoning tells us there should be a 50% chance to win the ga with 2 entries that adds to my global winning chance!
I entered 2 other ga for this day : one with 13 entries (myself included), and one with 588 entries (myself included) :
Let's name those ga A, B and C :
P(win A) = 1 / 2 = 0,5
P(win B) = 1 / 13 = 0,076923
P(win C) = 1 / 588 = 0,001701
P(loose A) = 1 - P(win A) = 1 - 0,5 = 0,5
P(loose B) = 1 - P(win B) = 1 - 0,076923 = 0,923077
P(loose C) = 1 - P(win C) = 1 - 0,001701 = 0,998299
P(loose on this day) = P(loose A AND loose B AND loose C)
= P(loose A) x P(loose B) x P(loose C)
= 0,5 x 0,923077 x 0,998299
= 0,460753
P(win on this day) = 1 - P(loose on this day)
= 1 - 0,460753
= 0,539247
Thus 53,92%... as shown on the graph.
As I said before, it's counter-intuitive : entering the 2 entries ga makes my probability to win above 50%, which is clearly correct. What was wrong-thinking at first is thinking the previous 7,85% chances to win would add to the 50% chances to win A when entering A, and then computing the 46,07% as the added chance to win by entering A, which is in fact not the chance to win A, which is confusing... Moreover this "added chance" idea will not compute to the same figures depending on which order your enter the gas...!
You can reach 100%, I've just checked, and if you prefer, you may want to compute it the other long way, fastidious way which is easier to understand : draw a tree of all possible outcomes, and compute probabilities of the good ones. Look at the fact the P(win A) doesn't add up by itself nowhere, it's always multiplicative with something else, either another win or another loss :
P(win thrice) = P(win A AND win B AND win C)
= P(win A) x P(win B) x P(win C)
= 0,5 x 0,076923 x 0,001701
= 0,000065
P(win twice) = P(win any two of A, B, C loosing the third)
= P( (win A AND win B AND loose C) OR (win A AND loose B AND win C) OR (loose A AND win B AND win C) )
= ( P(win A) x P(win B) x P(loose C) ) + ( P(win A) x P(loose B) x P(win C) ) + ( P(loose A) x P(win B) x P(win C) )
= ( 0,5 x 0,076923 x 0,998299 ) + ( 0,5 x 0,923077 x 0,001701 ) + ( 0,5 x 0,076923 x 0,001701 )
= 0,038396 + 0,000785 + 0,000065
= 0,039246
P(win once) = P(win any one of A, B, C loosing the two others)
= P( (win A AND loose B AND loose C) OR (loose A AND win B AND loose C) OR (loose A AND loose B AND win C) )
= ( P(win A) x P(loose B) x P(loose C) ) + ( P(loose A) x P(win B) x P(loose C) ) + ( P(loose A) x P(loose B) x P(win C) )
= ( 0,5 x 0,923077 x 0,998299 ) + ( 0,5 x 0,076923 x 0,998299 ) + ( 0,5 x 0,923077 x 0,001701 )
= 0,460753 + 0,038396 + 0,000785
= 0,499934
P(win on this day) = P(win once OR win twice OR win thrice)
= P(win once) + P(win twice) + P(win thrice)
= 0,000065 + 0,039246 + 0,499934
= 0,539245
Thus 53,92%...it works!
...years since I didn't did sooo many maths.... won't do it again before years.... 😅
Comment has been collapsed.

Getting luckier and luckier... (Unlike the real life 😉)

Comment has been collapsed.
kinda... "boring" curve, here.
as you said, tho, is fine :D

Comment has been collapsed.
Yeah, you're not entering much, just like me. Which makes our graphs rather boring. Oh well... ;)
Comment has been collapsed.
Not bad, but not great either. It's okay though because I'm not here just to win games. When I do, it makes me and my family's day! 😍

Comment has been collapsed.
I believe am more unlucky than you.

Comment has been collapsed.
As funny as it sounds - I have no idea what inflicted it. It's pretty ironic, since I'm the guy who was always saying "VAC is not given without reason".
Comment has been collapsed.
There have been lots of bans recently, even for absolutely no reason.
When you're experiencing such situation, you start believing that the system can really make huge mistakes.
(I won't even be surprised if there are guys who just have it in Library and don't play among the banned ones :D Classics.)
Comment has been collapsed.
Yesterday 2120 VAC bans were removed, theres been a recent wave of VACs recently, and a large number of the false positives were removed, so hopefully it gets automatically removed.
Comment has been collapsed.
Now you'll find out how a lot of SGT closed doors look like
Comment has been collapsed.
Oh no. Sorry that happened to you. VAC is known for false positives, because it flags people for anything that alters memory during runtime like purely visual mods, even if they didn't actually cheat. Wouldn't be so bad if they didn't mark you for life (and then don't allow any discussion about it because of their stupid zero tolerance policy). I always said this system is dangerous. People shouldn't be afraid to use mods.
Comment has been collapsed.

As if it was a green shore dipping in red waters.

Comment has been collapsed.
With mountains With valleys ⛩🛤🌅

Comment has been collapsed.
i have no idea how any of this is calculated, lol.

Comment has been collapsed.
It depends on the GAs you enter and the individual chance of winning any of them. Let's say you enter a GA with 10 entries. You have a 10% chance of winning or "0.1 game". Let's say you enter 6 GAs with 10 entries each and you win none of them. That means you are unlucky because according to probabilty, you should have won "0.6 games", so you'll have a "-0.6 gifts" reflected in the graph. Of course, this is an example so I'm using simple numbers to make calculations easy, but the math is always the same.
Comment has been collapsed.
ah, okay. so it's just probability in a squiggily line form. that makes sense i guess.
Comment has been collapsed.
Seems like I'm lucky enough ^^

Comment has been collapsed.
Overall, you've been neither lucky or unlucky, and won the exact number of gifts we estimated since you first joined.

Comment has been collapsed.
The less giveaway you enter, the less unlucky you are 🍪


Comment has been collapsed.
Not entering as many giveaways nowadays.

Comment has been collapsed.
I guess my luck is shifting for the better 😄
Comment has been collapsed.

My graph is mostly red, with some significant dips down. Didn't have much luck lately (which is fine, I've won more than enough). Anyone even more unlucky than me? Show me your graphs!
(Obligatory giveaways...)
Comment has been collapsed.